|
U.S. DOLLAR INDEX
(NYBOT_DX-NYSE):
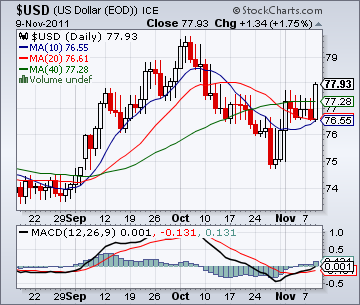
Technical Viewpoint: From a low
of $73.53 on Aug 29, 2011 prices
rallied, reaching a
high of $79.84
on Oct 4, 2011. A
decline saw prices pull back, reaching a
low of
$74.72 on Oct 27, 2011.
Another rally saw prices penetrate
resistance, closing 11/9/11
at $77.93. Technicals: MACD Index (MACD): A Buy Alert!
was given on Nov 9, 2011 when the solid line crossed the dotted line to the upside.
Support: Remains at $76.60. Resistance: Is at $78.69.
Point & Figure: Reversed to the upside on Nov 9, 2011. A P&F upside
reversal takes place at $75.00. Summary: Technical indicators have turned bullish. BUY! U.S. DOLLAR INDEX
(NYBOT_DX-NYSE) @ $78.01 Stop: Use a protective stop of $75.00.
U.S. DOLLAR INDEX is currently trading @ $77.93 plus $1.34 on Nov 9, 2011. Price Objective:
$88.00. Risk/Reward: $3.00 VS. $10.00. Today's Risk Reward Ratio: 3:1
|
Click here to view full size chart
|
