|
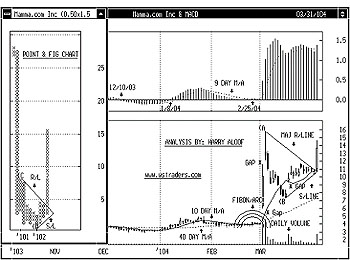
MAMA.COM INC
(MAMA-Nasdaq):
Technical Viewpoint: From a low
of $3.91 on Mar 1, 2004 prices
rallied, reaching a
high of $15.80
on Mar 3, 2004. A
decline saw prices pull back, reaching a
low of
$7.30 on Mar 15, 2004.
Another rally saw prices penetrate
resistance, closing 3/31/04
at $13.68. Technicals: MACD-Histogram (MACD-H): A Buy Alert!
was given on Feb 25, 2004 when the Histogram crossed the "0" line to the upside.
Support: Remains at $10.75. Resistance: Is at $15.80.
Point & Figure: Reversed to the upside on Mar 31, 2004. A P&F upside
reversal takes place at $14.00. Summary: Technical indicators have turned bullish. BUY! MAMA.COM INC
(MAMA-Nasdaq) @ $14.75 Stop: Use a protective stop of $13.25.
MAMA.COM INC is currently trading @ $13.68 plus $2.97 on Mar 31, 2004. Price Objective:
$23.00. Risk/Reward: $1.50 VS. $8.25. Today's Risk Reward Ratio: 5:1
|
Click here to view full size chart
|
