|
XL CAPITAL LTD
(XL-NYSE):
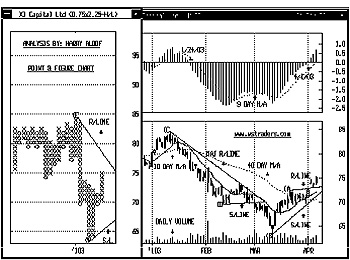
Technical Viewpoint: From a low
of $69.68 on Feb 13, 2003 prices
rallied, reaching a
high of $73.70
on Feb 21, 2003. A
decline saw prices pull back, reaching a
low of
$63.49 on Apr 4, 2003.
Another rally saw prices penetrate
resistance, closing 4/4/03
at $75.17. Technicals: MACD-Histogram (MACD-H): A Buy Alert!
was given on Apr 1, 2003 when the Histogram crossed the "0" line to the upside.
Support: Remains at $71.75. Resistance: Is at $77.08.
Point & Figure: Reversed to the upside on Apr 1, 2003. A P&F upside
reversal takes place at $72.75. Summary: Technical indicators have turned bullish. BUY! XL CAPITAL LTD
(XL-NYSE) @ $75.38 Stop: Use a protective stop of $72.63.
XL CAPITAL LTD is currently trading @ $75.17 plus $1.63 on Apr 1, 2003. Price Objective:
$95.00. Risk/Reward: $2.75 VS. $19.63. Today's Risk Reward Ratio: 7:1
|
Click here to view full size chart
|
