|
MEDCO HEALTH SOLUTIONS
(MHS-NYSE):
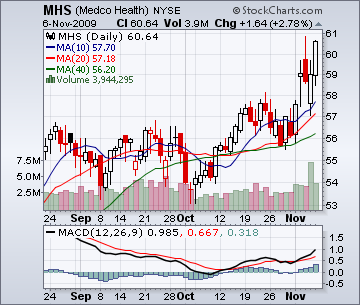
Technical Viewpoint: From a low
of $29.80 on Oct 27, 2009 prices
rallied, reaching a
high of $48.95
on Feb 6, 2009. A
decline saw prices pull back, reaching a
low of
$36.46 on Mar 16, 2009.
Another rally saw prices penetrate
resistance, closing 11/6/09
at $60.64. Technicals: MACD Index (MACD): A Buy Alert!
was given on Nov 3, 2009 when the solid line crossed the dotted line to the upside.
Support: Remains at $49.00. Resistance: Is at $60.90.
Point & Figure: Reversed to the upside on Mar 16, 2009. A P&F upside
reversal takes place at $57.00. Summary: Technical indicators have turned bullish. BUY! MEDCO HEALTH SOLUTIONS
(MHS-NYSE) @ $61.13 Stop: Use a protective stop of $58.63.
MEDCO HEALTH SOLUTIONS is currently trading @ $60.64 plus $4.52 on Nov 6, 2009. Price Objective:
$72.50. Risk/Reward: $2.50 VS. $11.37. Today's Risk Reward Ratio:
|
Three Part
Technical Chart
Daily Candle Stick Chart
Point & Figure Chart
Technical Study
View full size chart
Price Objective:
$72.50
Risk/Reward:
$2.50 VS. $11.37
Risk/Reward Ratio:
|
