|
FREEPORT MCMORAN C&G
(FCX-NYSE):
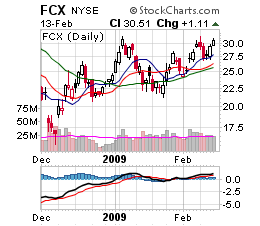
Technical Viewpoint: From a low
of $24.22 on Feb 2, 2009 prices
rallied, reaching a
high of $31.25
on Feb 9, 2009. A
decline saw prices pull back, reaching a
low of
$26.80 on Feb 10, 2009.
Another rally saw prices penetrate
resistance, closing 2/13/09
at $30.51. Technicals: MACD Index (MACD): A Buy Alert!
was given on Jan 30, 2009 when the solid line crossed the dotted line to the upside.
Support: Remains at $27.00. Resistance: Is at $31.50.
Point & Figure: Reversed to the upside on Feb 13, 2009. A P&F upside
reversal takes place at $28.00. Summary: Technical indicators have turned bullish. BUY! FREEPORT MCMORAN C&G
(FCX-NYSE) @ $31.13 Stop: Use a protective stop of $29.13.
FREEPORT MCMORAN C&G is currently trading @ $30.51 plus $1.11 on Feb 13, 2009. Price Objective:
$41.50. Risk/Reward: $2.00 VS. $10.37. Today's Risk Reward Ratio: 5:1
|
Three Part
Technical Chart
Daily Candle Stick Chart
Point & Figure Chart
Technical Study
View full size chart
Price Objective:
$41.50
Risk/Reward:
$2.00 VS. $10.37
Risk/Reward Ratio:
5:1
|
